CW DATE:
TITLE:
ENTRY TASK:
INTRODUCTION
KEY TERMS:
ACTIVITIES:
PLENARY:
HW:
Introduction (2 lessons) - as cover lessons - Worksheet - HERE
Lesson 1
CW DATE:
8A2 14th September 2018
8B3 17th September 2018
TITLE: What Causes the Weather?
ENTRY TASK:
In your exercise book, make a spider diagram to show the different types of weather... as many as you can (... can you think of 10?)
KEY TERMS:
Weather - The condition of the atmosphere over a short period of time e.g. a day
Climate - The average conditions in the atmosphere expected at a certain time of year and in a certain place. It is built up from records over a 30 year period at least.
Examples of weather - Photo Album pp 69 geog 2
ACTIVITIES:
1. Read carefully through page 71 of the Geog 2 text and then complete the word-fill activity provided (HERE)
2. Complete activities 2, 3 and 4 from page 71 of the Geog 2 text.
PLENARY:
What do you think the weather would be like if the Sun heated the Earth's surface evenly?
Further Learning:
CW DATE:
8A3 14th September 2018
8B2 th September 2018
TITLE:
Weather and Climate Introduction - Completion work
ENTRY TASK:
What is the key difference between weather and climate?
KEY TERMS:
Weather - The condition of the atmosphere over a short period of time e.g. a day
Climate - The average conditions in the atmosphere expected at a certain time of year and in a certain place. It is built up from records over a 30 year period at least.
8A3/8b3 Here: ACTIVITIES:
a. Finish the activities from the learning pack... then tag into your books.
b. Test your knowledge using the quiz - "1b. Weather and Climate Intro Quiz" in Y8 W and C folder.
PLENARY:
Further Learning:
Why does warm air rise?
19th Sep 8B2
21st Sep 8A2
See above... 10 minutes finishing off, 5 mins filing.
5 mins quick quiz
Lesson 2
CW DATE:
8B3 - 19th September 2018
8A2 - 21st September 2018
TITLE: Types of Rainfall
ENTRY TASK:
- Rain vid/audio linke - HERE
- What is rain?
- Can you describe at least TWO different types of Rain?
KEY TERMS:
Convection - Rising due to heating, expansion, reduced mass and increased bouyancy.
Relief - The shape of the land e.g. high or low, steep or flat
Front - the zone where different air masses meet
ACTIVITIES: 8B2 from here NL
8A3 from here 26th Sep
Source sheet - HERE
Note: pp 3 has supplemented illustrations for students to view and make notes from display.
Additional Support - HERE
28th Sept 2018:
8A to complete Relief and Frontal rain annotation of diagrams.
...then answer the questions at bottom of the source sheet.
Get filed
PLENARY:
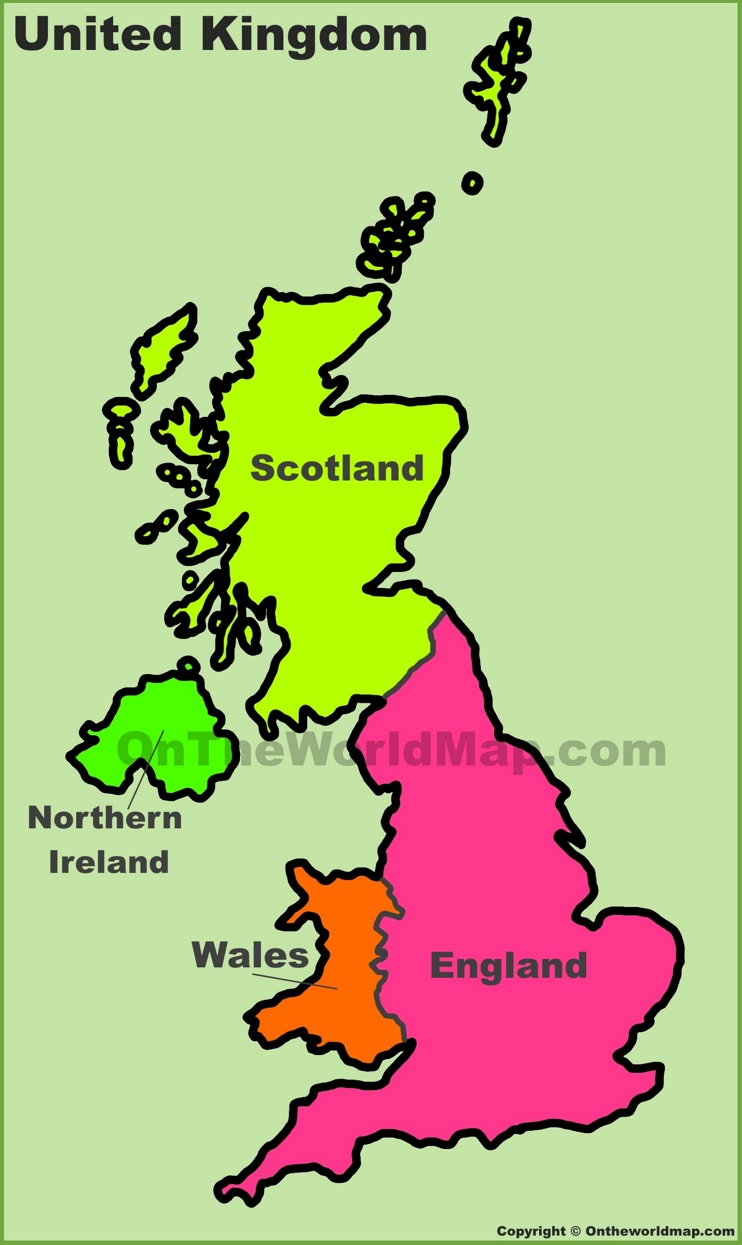 If you lived in West Wales... you would receive more rain than we do in London. Why?
Which of the two maps (right and below) helps us to understand why West Wales receives MORE rain? Why?
FURTHER LEARNING:
CW DATE:
8B2 - 1st October 2018
8A3 - 5th October 2018
TITLE:
Be a Weather Expert
Introduction: One of the very best ways to learn something is to teach it to someone else :)
ENTRY TASK:
What are the three ways that rain can be caused? Tell your partner.
KEY TERMS:
We have already met these... can you remember?
Convection - Rising due to heating, expansion, reduced mass and increased buoyancy.
Relief - The shape of the land e.g. high or low, steep or flat
Front - the zone where different air masses meet
ACTIVITIES:
1. Be the expert - Source Slide Presentation - HERE

HW:
CW DATE:
8B2 3rd and 8th October 2018
8A3 10th October 2018
TITLE:
High and Low Air Pressure
Vid Source HERE
INTRODUCTION
From the notes below, copy the items in BLUE
Although we do not notice it, the air above us weighs...
...at sea level the area of the top of your head and shoulders is about 0.1 square metres. All the molecules of air in the atmosphere above your head weigh the equivalent of around10,000 kg per square metre. This means that the mass of the air above the 0.1 square metre cross section of your body is 1,000 kg, or a tonne.
If you tried to lift a small car, you’d certainly notice it, so why don’t we notice that there’s a tonne of air pressing down on us? Well, the air exerts this force in all directions, so as well as pushing down on us, it also pushes up and balances out the force on our bodies so that we don’t collapse.
Human bodies are also used to air pressure. The air pressure in our lungs, ears and stomachs is the same as the air pressure outside of our bodies, which ensures that we don’t get crushed.
However, the weight or air "pressure" does change...
ENTRY TASK:
Thinking about the last few lessons... and discussing with your partner, can you suggest what conditions might lead to a small decrease in the Air Pressure?
KEY TERMS:
Air Pressure - The weight of air pushing down on us from above.
ACTIVITIES:
1. Study page 76 in the Geog 2 text. Using the information there...
You are advised to use diagrams to help your explanations.
a. explain how air pressure becomes lower in some places.

b. explain how low pressure in one place causes wind to blow.
c. explain why other places get slightly higher pressure.

8A3 up to here - Review High and Low Pressure NL and then onto associated weather (below)
CW DATE:
8A3 12th October 2018
TITLE:
High and Low Air Pressure (Continued)
Review High and Low Pressure HERE
then onto associated weather (below)
2. Shared reading and discussion - page 77.
3. Sort It Out - activity - HERE (Fill in the missing words using the reading/discussion of pp77 to help... Wordbox HERE)
PLENARY:
During periods of HIGH PRESSURE in the summer... why does it sometimes rain?
HW:
Two worksheets to complete (Kerb - 5.5 F and H)
Set for 8B/8A already... due in NL
iCt (c107) booked for 8B 15th and 17th Oct.
iCt (c106) booked for 8A 31st Oct and (c107) for 2nd Nov
CW DATE:
8B 15th October 2018
8A 19th October 2018
TITLE:
Why is weather in the UK so changeable?
ENTRY TASK:
Think back... over the last week, what has the weather been like?
Pretty changeable?
INTRODUCTION
The quiet changeable weather that we experience in the UK is due to where the UK s located globally... we lie about half way between the equator and the North Pole. Here, air from both locations frequently meets causing different weather... sometimes from one hour to the next!
KEY TERMS:
Air mass - A large "block" of air in the atmosphere that possesses certain characteristics of temperature and moisture. These air masses move from their source regions to new regions, driven by global pressure systems.

ACTIVITIES:
Text book pp78/9
1.
Activity sheet - HERE (Air mass characteristics and source regions).
2.
5.6 Animation on Kerboodle - Students complete (in ict room) link address on wk sheet above - or this:
Can also access direct from digi text.
8A3 will need to do task 4 below prior to iCt work (3) as no access to ict rooms until after half term
3. Complete the Kerboodle online assessment (8A3 to do after half term) (assigned) - 5.6 (for 8B3 from 15th Oct closes 19th Oct. For 8A3 from 31st Oct to 3rd November)
4.
Task 2 and 3 pp 79 Geog 2
PLENARY:
HW:
CW DATE:
8B2 17th October 2018
8A3 2nd November 2018
TITLE:
Weather measurement and forecasting
ENTRY TASK:
View the video - Introduction to Forecasting the Weather - HERE
INTRODUCTION

Weather forecasters often tell us about "Fronts". These are just the position of the leading edge of an air mass. So a warm front tells us that warm air is arriving and a cold from that cold air is arriving.

KEY TERMS:
Warm Front - The Leading Edge of a Warm Air Mass
Cold Front - The Leading Edge of a Cold Air Mass
Occluded Front - Where the Cold Front has caught up with a Warm Front and pushed beneath it thus lifting the Warm Air Mass off the ground!
See pp 6, 7, 8 of student/support sheet HERE
ACTIVITIES:
1. Complete the online test assigned to you via Kerboodle. (many completed last lesson)
2. Forecast the weather using the resources provided. Work in pairs to produce a weather report. - HERE (Started last lesson)
Guidance for the forecasting task... Follow these steps:
a. What is the temperature?
b. What is the Wind Speed?
c. Is there likely to be Cloud?
d. What Precipitation is expected?
e. What weather hazards should people be prepared for?
Repeat the above for a different area of the UK... you choose.
PLENARY:
HW:
CW DATE:
5th November 2018
TITLE: Predicting the Weather
ENTRY TASK:
Using the sheet provided (Kerb. 5.2 F) to illustrate the different parts of the atmosphere. (ALREADY DONE IN INTRO PACK - 2018)
Use sheet 5.3 Measuring the Weather sheet.
KEY TERMS:
Weather System - A high or low pressure cell that is associated with a range of predictable weather conditions.
Synoptic Chart - Maps used to show the atmospheric pressure some additional weather features such as the position of Fronts.
ACTIVITIES:
1. Kerboodle Sheets 5.6 (f and ex) to set.
2. Grp work - Synoptic Charts - HERE
Synoptic Charts Sourced from - HERE
PLENARY:
Groups feedback.
HW:
Record your weather observations for Thursday and Friday this week. Include amount of cloud, wind (direction and speed), precipitation, temperature...

Blocking Highs have prevented our weather system from pushing hard over the UK... !
Low pressure system has forced Hp to the East... What was the weather like over the Week End?
Feedback session - from 8A NL.. see my comments added to source sheet for review.
CW DATE:
8A2 23rd November 2018
TITLE:
Introduction to Climate
Source sheet - HERE
ENTRY TASK:
Define the term "Weather"...
What then is "Climate"? (Do you think)
INTRODUCTION
Weather and climate are two terms that people often use for the same thing. However, in Geography they have very specific and somewhat different meanings...
KEY TERMS:
Climate - The average expected conditions of the atmosphere for a place at a specific time of year. It can include elements of weather such as temperature and precipitation, but also things like seasons.
Climate data is usually collected over a long period (at least 30 years) of time and then averaged out.
Stop and Jot: Using the text above, write your own definition of the KEY TERM - "Climate"
ACTIVITIES:
1. Climate regions (map with key + locations...)

a and b done in class... no text books!
2. Climate graphs:


Above Qs completed and checked in class.
Follow on working 28th November... NB review key concepts from above and possibly complete tasks unable to complete due to lack of books!
3. Drawing a climate graph, describing it and then working out which climatic region it belongs to
NB see spreadsheet for modelling - HERE

See Spread Sheet for Template - HERE
PLENARY:
HW:
ENTRY TASK:
Thinking about the last few lessons... and discussing with your partner, can you suggest what conditions might lead to a small decrease in the Air Pressure?
KEY TERMS:
Air Pressure - The weight of air pushing down on us from above.
ACTIVITIES:
1. Study page 76 in the Geog 2 text. Using the information there...
You are advised to use diagrams to help your explanations.
a. explain how air pressure becomes lower in some places.
b. explain how low pressure in one place causes wind to blow.
c. explain why other places get slightly higher pressure.
8A3 up to here - Review High and Low Pressure NL and then onto associated weather (below)
CW DATE:
8A3 12th October 2018
TITLE:
High and Low Air Pressure (Continued)
Review High and Low Pressure HERE
then onto associated weather (below)
2. Shared reading and discussion - page 77.
3. Sort It Out - activity - HERE (Fill in the missing words using the reading/discussion of pp77 to help... Wordbox HERE)
PLENARY:
During periods of HIGH PRESSURE in the summer... why does it sometimes rain?
HW:
Two worksheets to complete (Kerb - 5.5 F and H)
Set for 8B/8A already... due in NL
iCt (c107) booked for 8B 15th and 17th Oct.
iCt (c106) booked for 8A 31st Oct and (c107) for 2nd Nov
CW DATE:
8B 15th October 2018
8A 19th October 2018
TITLE:
Why is weather in the UK so changeable?
ENTRY TASK:
Think back... over the last week, what has the weather been like?
Pretty changeable?
INTRODUCTION
The quiet changeable weather that we experience in the UK is due to where the UK s located globally... we lie about half way between the equator and the North Pole. Here, air from both locations frequently meets causing different weather... sometimes from one hour to the next!
KEY TERMS:
Air mass - A large "block" of air in the atmosphere that possesses certain characteristics of temperature and moisture. These air masses move from their source regions to new regions, driven by global pressure systems.

ACTIVITIES:
Text book pp78/9
1.
Activity sheet - HERE (Air mass characteristics and source regions).
2.
5.6 Animation on Kerboodle - Students complete (in ict room) link address on wk sheet above - or this:
"4. Go to the following web address to view the animation and activities:"
Can also access direct from digi text.
8A3 will need to do task 4 below prior to iCt work (3) as no access to ict rooms until after half term
3. Complete the Kerboodle online assessment (8A3 to do after half term) (assigned) - 5.6 (for 8B3 from 15th Oct closes 19th Oct. For 8A3 from 31st Oct to 3rd November)
4.
Task 2 and 3 pp 79 Geog 2
PLENARY:
HW:
Kerboodle Sheets 5.6 (f and ex) to set.
CW DATE:
8B2 17th October 2018
8A3 2nd November 2018
TITLE:
Weather measurement and forecasting
ENTRY TASK:
View the video - Introduction to Forecasting the Weather - HERE
INTRODUCTION
Weather forecasters often tell us about "Fronts". These are just the position of the leading edge of an air mass. So a warm front tells us that warm air is arriving and a cold from that cold air is arriving.
KEY TERMS:
Warm Front - The Leading Edge of a Warm Air Mass
Cold Front - The Leading Edge of a Cold Air Mass
Occluded Front - Where the Cold Front has caught up with a Warm Front and pushed beneath it thus lifting the Warm Air Mass off the ground!
See pp 6, 7, 8 of student/support sheet HERE
ACTIVITIES:
1. Complete the online test assigned to you via Kerboodle. (many completed last lesson)
2. Forecast the weather using the resources provided. Work in pairs to produce a weather report. - HERE (Started last lesson)
Guidance for the forecasting task... Follow these steps:
- Choose either map C or Map D.
- Decide... is your chosen map showing High or Low Pressure?
- What time of year is it for?
- What will the weather be like... answer the following questions for the SOUTH EAST of England:
a. What is the temperature?
b. What is the Wind Speed?
c. Is there likely to be Cloud?
d. What Precipitation is expected?
e. What weather hazards should people be prepared for?
Repeat the above for a different area of the UK... you choose.
PLENARY:
HW:
CW DATE:
5th November 2018
TITLE: Predicting the Weather
ENTRY TASK:
Using the sheet provided (Kerb. 5.2 F) to illustrate the different parts of the atmosphere. (ALREADY DONE IN INTRO PACK - 2018)
Use sheet 5.3 Measuring the Weather sheet.
KEY TERMS:
Weather System - A high or low pressure cell that is associated with a range of predictable weather conditions.
Synoptic Chart - Maps used to show the atmospheric pressure some additional weather features such as the position of Fronts.
ACTIVITIES:
1. Kerboodle Sheets 5.6 (f and ex) to set.
2. Grp work - Synoptic Charts - HERE
Synoptic Charts Sourced from - HERE
PLENARY:
Groups feedback.
HW:
Record your weather observations for Thursday and Friday this week. Include amount of cloud, wind (direction and speed), precipitation, temperature...
Blocking Highs have prevented our weather system from pushing hard over the UK... !

Low pressure system has forced Hp to the East... What was the weather like over the Week End?
Feedback session - from 8A NL.. see my comments added to source sheet for review.
CW DATE:
8A2 23rd November 2018
TITLE:
Introduction to Climate
Source sheet - HERE
ENTRY TASK:
Define the term "Weather"...
What then is "Climate"? (Do you think)
INTRODUCTION
Weather and climate are two terms that people often use for the same thing. However, in Geography they have very specific and somewhat different meanings...
KEY TERMS:
Climate - The average expected conditions of the atmosphere for a place at a specific time of year. It can include elements of weather such as temperature and precipitation, but also things like seasons.
Climate data is usually collected over a long period (at least 30 years) of time and then averaged out.
Stop and Jot: Using the text above, write your own definition of the KEY TERM - "Climate"
ACTIVITIES:
1. Climate regions (map with key + locations...)
Look at the map (Map A on page 86 in the Geog 2 text). What is the climate like at:
a. L? b. D? c. E? d. J?
a and b done in class... no text books!
2. Climate graphs:
Above Qs completed and checked in class.
Follow on working 28th November... NB review key concepts from above and possibly complete tasks unable to complete due to lack of books!
3. Drawing a climate graph, describing it and then working out which climatic region it belongs to
NB see spreadsheet for modelling - HERE
Avg. Temperature (°C)
|
26.9
|
27
|
27.1
|
27.1
|
27.1
|
27.1
|
27.7
|
28.2
|
28.2
|
28
|
27.5
|
27.4
|
Precipitation /
Rainfall (mm)
|
267
|
261
|
295
|
282
|
210
|
109
|
76
|
56
|
77
|
125
|
165
|
222
|
See Spread Sheet for Template - HERE
PLENARY:
HW:
CW DATE:
8A2 - 28th November 2018
TITLE:
Drawing and Interpreting a Climate Graph
(Continued from last session)
Source sheet - HERE
ENTRY TASK:
Climate or weather?

- In Barbados the temperature was unusually cool for the time of year.
- The temperature on the island of Tenerife in November is between 17oC and 23oC
- December is the wettest month in London with around 80mm
- Heavy rain is expected to reach London by mid afternoon.
INTRODUCTION
As we found out last lesson, the Climate is the average expected conditions of the atmosphere that we would expect in a certain place at a certain time of year. Climate date is obtained by calculating the average conditions over at least ...... years.
What is the average of the following data?
10, 12, 8?
10 + 12 + 8 = 30/3 = 10
KEY TERMS:
Describe - Say what something is like
Interpret - Say what something means
Total - Comprising the whole amount (obtained by adding values together)
Average - A central value (obtained by adding together several amounts and then dividing this total by the number of amounts).
Range - The difference between upper and lower values of a set of data
ACTIVITIES:
1. Using your data from last lesson, construct/draw a climate graph...
J
|
F
|
M
|
A
|
M
|
J
|
J
|
A
|
S
|
O
|
N
|
D
| |
Avg. Temperature (°C)
|
26.9
|
27
|
27.1
|
27.1
|
27.1
|
27.1
|
27.7
|
28.2
|
28.2
|
28
|
27.5
|
27.4
|
Precipitation /
Rainfall (mm)
|
267
|
261
|
295
|
282
|
210
|
109
|
76
|
56
|
77
|
125
|
165
|
222
|
Remember the key features of a climate graph...
Use the template, or graph paper...
See Spread Sheet for Template - HERE
To complete the climate graphs first thing NL.
Source sheet - HERE
2. Describe the climate for the place represented by your graph? (see template/scaffold - pp3 Source sheet - HERE )
PLENARY:
Compare the climate graph you have drawn with that for London on the previous worksheet...
Which of the two has the most seasonal climate?
Why do you think this might be?
HW:
CW DATE: 10th December 2018
TITLE:
Weather Assessment - Its All About Weather!
Source Sheet - HERE
ENTRY TASK:
Access the assessment document on Google Classroom.
INTRODUCTION
This is an assessment... so examination conditions apply!
All your work will need to be done on the google document that you have been sent.
At the end of the assessment, you must SUBMIT your document.
KEY TERMS:
NA
ACTIVITIES:
Complete the assessment
PLENARY:
HW:
CW DATE: 8th and 9th January 2019
TITLE:
Why do climates vary from place to place?
Source Sheet - HERE
ENTRY TASK:
Study the data table provided.
Which place is hottest in August
Which is coldest in August?
Which is the driest place in the table?
INTRODUCTION
Climates around the world vary a lot. At the same time of year, places can be hot or cold, dry or rainy. There are several reasons for these differences. In today's lesson we are going to learn about them.
KEY TERMS:
Latitude - Distance from the Equator
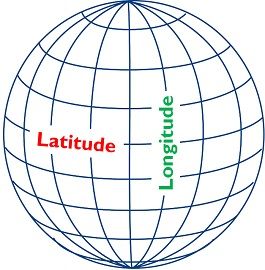 Hemisphere - Half a globe or sphere
 Orbit - Circular path of a planet around a star eg Earth around the Sun
Prevailing wind - most common wind direction
Altitude - height above sea level

ACTIVITIES:
Two Key Factors affecting Climate are Latitude combined with the curvature of the Earth's surface and the Earth's tilt. Here is how...
Let's start with Latitude and the Earth's curved surface. The most intense heating is at the equator...
The Earth's Tilt:
The UK is in the NORTHERN HEMISPHERE... in which month will it get most energy and be hottest?
Why is December a cold month in the UK?
What kind of weather would you have if you spent Christmas in Australia (in the Southern Hemisphere)?
Complete the Activity Sheet provided (5.9)
8A3 - Done wksh 5.9 or completing for HW
Wk sheet to do by 8B on Monday 14th Jan
PLENARY:
HW:
CW DATE:
8A - 11th January 2019
8B - 14th January 2019
TITLE:
Our Warming Planet
Source sheet: HERE
ENTRY TASK:
Complete the sheet 5.10 (Climates around the World)
Summarise in writing what this sheet shows about Global Climates
INTRODUCTION
 Look at the image (left)... What is this protest about?
Why are people making this protest?
Complete the following:
- Temperatures around the world are rising. We call it ................ warming.
- Some scientists say it is a ............... change.
- Most scientists, however, say it is mainly due to .............. dioxide gas and other pollutants released through human activity.
- Rising global temperatures bring changes in rainfall, wind patterns, ocean currents ie climate change!
- Climates are already ............... around the world.
- Action is possible to limit the amount and rate of climate change, but governments and ................ have to take control.
Wordbox:
Citizens Global Changing Natural Carbon
Re. item 2 above... debunking climate denial:
Source: HERE
That humans are causing global warming is the position of the Academies of Science from 80 countries plus many scientific organizations that study climate science. More specifically, around 95% of active climate researchers actively publishing climate papers endorse the consensus position.
Discuss/Feedback/Jot - What does the statement above tell us about denial of climate change?
8B from Here NL on 16th Jan 2019 - maybe skip...
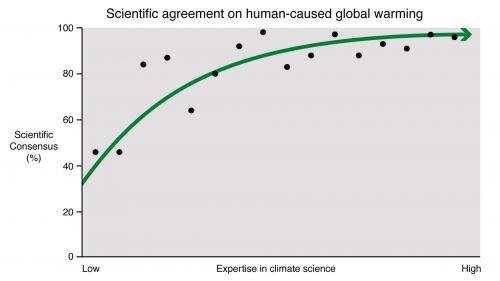
Use the graph above to respond to the position that climate change is natural (Statement 2 above).
KEY TERMS:
List the key terms used in this lesson and give a definition for each.
Denial - Refusal to acknowledge an unacceptable truth
Natural - Existing in or derived from nature; not made or caused by humankind.
Carbon dioxide - A Greenhouse Gas (contributes to global warming)
Debunking - Expose the falseness or hollowness of (an idea or belief)
Endorse - Declare one's public approval or support of.
ACTIVITIES:


Write a statement making two clear points about climate change…
One should be about whether it is happening or not (giving evidence/supporting argument) and the other should describe why people should take it seriously and take action.
PLENARY:
Share your ideas from the activity above with a partner.
HW:
Using the map extract, shade the areas that would be affected by the melting of
- The Greenland Ice Sheet.
- The Antarctic Ice Sheet.
- Find out how far above sea level you live.

Adapted...

NL move on... past climate change + enhanced greenhouse effect...
CW DATE:
21st January 2018
TITLE:
Past Climate Change on Earth
See support sheet - HERE
ENTRY TASK:
Read through the cartoons on page 90
What does it reveal about the past climates on Earth? (Write your answer in your exercise book).
INTRODUCTION
Evidence from .......... ........, layers of mud at the bottom of bogs, ............... and lakes plus the gasses trapped in ........ formed thousands of years ago reveals that the climate on Earth has gone through many episodes of .............. and ................
WORDBOX
oceans cooling tree rings warming ice
KEY TERMS:
Fluctuate -
ACTIVITIES:
Using pp 90/91 of Geog 2 text complete activities 1 to 5.
See support sheet - HERE
PLENARY:
For how long has the UK climate been "comfortable" for human habitation? How do you know?
HW:
Above lesson done with 8A using the text and class reading/discussion as prelude to writing and answering Q 1 and 2 on pp 91... to complete.
Paris Accord Trailer - HERE
Paris Accord Trailer - HERE
CW DATE:
8A - 25th January 2019
8B - 28th January 2019TITLE:
The causes of climate change on Earth.
ENTRY TASK:
Evidence tells us that the climate on earth has ................. many times. Sometimes it has been much ............... than today, at other times much warmer. The very coldest episodes are called
....... ............ when large areas of the planets surface were covered in ice sheets (sometimes kilometers thick). Today we are in an "............................", a period between ice ages. This began in the UK only about 10,000 to 11,000 years BP (Before Present)
WORDBOX
ICE AGES changed INTERGLACIAL colder
INTRODUCTION
In today's lesson we will be exploring some of the causes of climate change affecting Earth.
Scientists have studied the causes of climate change and recognise, that in the past these were natural. Today, however, most experts agree that humans are having a large impact on our climates... they have concluded the following things:

KEY TERMS:

Global Warming - The rising average temperature of the Earth's atmosphere.
Climate Change - Long term changes that affect the temperature and precipitation patterns of the world.

Note that the horizontal scale changes!
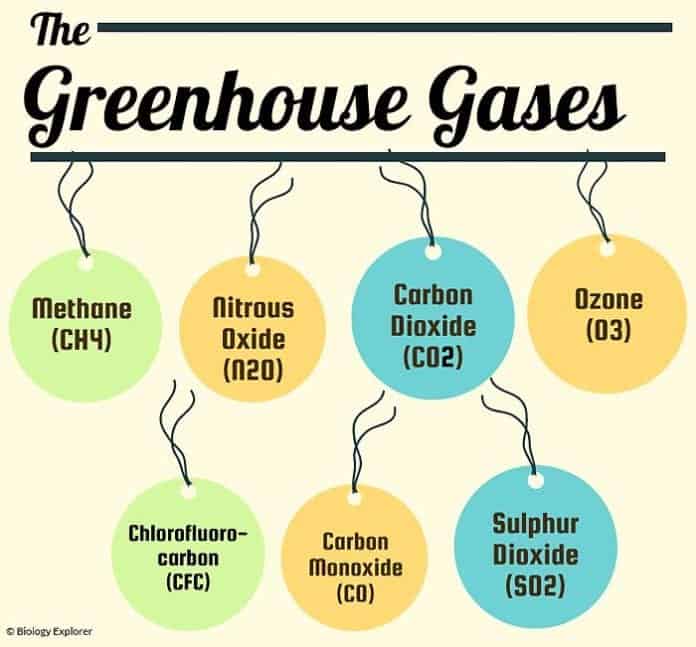 Greenhouse Gasses - A range of gases that have the property of reducing the flow of heat energy through the upper atmosphere e.g. Carbon dioxide.
Axial Tilt - The deviation of the Earth's axis of rotation away from the vertical.
Vid - HERE

ACTIVITIES:
1. How does the NATURAL Greenhouse effect work?
Drawing GH effect diagram...
2. How have people changed and increased it?
Adding the Anthropogenic component...
8A finished 2 above, but did not get to point of adding evidence from the graph below!
3. What is the evidence that people are responsible for the recent changes (Correlation pp 92 - Changes in Global Temperature since 1850 relative to the average temperature 1961 to 1991):

4. What evidence is there that Climate Change is happening?
PP 96/7
a. Describe and explain two pieces of evidence that appear to prove that Climate Change is already happening.
b. Write a conclusion to outline how technological change and the use of new resources in the 1800s is affecting Polar Bears in the Arctic.
c. Draw a picture to go with your conclusion.
PLENARY:
The Polar Vortex - HERE
HW:
8A - 25th January 2019
8B - 28th January 2019TITLE:
The causes of climate change on Earth.
ENTRY TASK:
Evidence tells us that the climate on earth has ................. many times. Sometimes it has been much ............... than today, at other times much warmer. The very coldest episodes are called
....... ............ when large areas of the planets surface were covered in ice sheets (sometimes kilometers thick). Today we are in an "............................", a period between ice ages. This began in the UK only about 10,000 to 11,000 years BP (Before Present)
WORDBOX
ICE AGES changed INTERGLACIAL colder
INTRODUCTION
In today's lesson we will be exploring some of the causes of climate change affecting Earth.
Scientists have studied the causes of climate change and recognise, that in the past these were natural. Today, however, most experts agree that humans are having a large impact on our climates... they have concluded the following things:
KEY TERMS:
Global Warming - The rising average temperature of the Earth's atmosphere.
Climate Change - Long term changes that affect the temperature and precipitation patterns of the world.
Note that the horizontal scale changes!
Greenhouse Gasses - A range of gases that have the property of reducing the flow of heat energy through the upper atmosphere e.g. Carbon dioxide.Axial Tilt - The deviation of the Earth's axis of rotation away from the vertical.
Vid - HERE
ACTIVITIES:
1. How does the NATURAL Greenhouse effect work?
Drawing GH effect diagram...
2. How have people changed and increased it?
Adding the Anthropogenic component...
8A finished 2 above, but did not get to point of adding evidence from the graph below!
3. What is the evidence that people are responsible for the recent changes (Correlation pp 92 - Changes in Global Temperature since 1850 relative to the average temperature 1961 to 1991):
4. What evidence is there that Climate Change is happening?
PP 96/7
a. Describe and explain two pieces of evidence that appear to prove that Climate Change is already happening.
b. Write a conclusion to outline how technological change and the use of new resources in the 1800s is affecting Polar Bears in the Arctic.
c. Draw a picture to go with your conclusion.
PLENARY:
The Polar Vortex - HERE
HW:
CW DATE:
8A 4th February 2019
8B 6th February 2019
TITLE:
Climate Change: Its Happening Already...
Textbook pp 96/7 and 100/101
ENTRY TASK:
Study page 92 in the Geog 2 text
What are two causes of climate change that people do not cause and cannot control?
INTRODUCTION
Natural changes in the position of the Earth relative to the Sun involve how it's Axial Tilt and it path around the Sun affect the amount of energy received from the Sun over very long timescales. In addition, there are variations in the amount of energy emitted by the Sun... Solar flares, for example increase energy.
KEY TERMS:
Tundra - a vast, flat, treeless Arctic region of Europe, Asia, and North America in which the subsoil is permanently frozen.
Permafrost - a thick subsurface layer of soil that remains below freezing point throughout the year, occurring chiefly in polar regions including TUNDRA.
Drought - a prolonged period of abnormally low rainfall, leading to a shortage of water.
ACTIVITIES:
Complete activities 1, 2, 3 and 5 from the text pp 97.
8B - Could not do as texts missing!
PLENARY:
The Polar Vortex - HERE
Read page 100/101
HW:
For the last lesson on Climate - Students to work in pairs, on A3 paper to complete activities on pp 101
Possibly show Day after Tomorrow (Polar Vortext link)
CW DATE:
TITLE:
ENTRY TASK:
INTRODUCTION
KEY TERMS:
ACTIVITIES:
PLENARY:
HW:
CW DATE:
TITLE:
ENTRY TASK:
INTRODUCTION
KEY TERMS:
ACTIVITIES:
PLENARY:
HW:
No comments:
Post a Comment
Note: only a member of this blog may post a comment.